Before I start this post, a quick introduction to Correlation for those of you who skipped Stats 101.
Correlation :
A correlation is a single number that describes the degree of relationship between two variables.
Source : https://socialresearchmethods.net/kb/statcorr.php
We start with proposing a hypothesis. For example, a relation between height and weight. My hypothesis is, If a person is taller, he’ll most probably be heavier. Now, we want to test this hypothesis. How do we verify that one variable has a positive, negative, or zero relationship with the other? We check the correlation between the two. A positive correlation implies that an increase in variable x, means an increase in variable y. The taller you are, the greater your weight will be. A negative correlation implies that an increase in variable x, means a decrease in variable y. A drop in temparature means an increase in jacket sales. Finally, A zero correlation means that there is no relationship between the two variables. While analysing our datasets, we hope for high positive or negative correlation between features, because this allows us to model relationships in a better way, than if we had a near-zero correlation.
“It is a capital mistake to theorize before one has data.” — Arthur Conan Doyle
Let’s take an example dataset, so we can get a better idea about how to go about the calculation and inference process.
| Variable | Data |
|---|---|
Height (x) | 68, 71, 78, 61, 67, 65, 72, 73, 65, 69 |
Weight (y) | 80, 84, 92, 73, 78, 75, 86, 87, 72, 75 |
Why do we need correlation?
If you’ve got an intution from the above examples, you’ll realise that correlation plays a very important role in predictive as well as verification applications. if there’s a positive or negative correlation between variables, we can use this to model and predict future or intermediate values. We also use it to confirm the hypotheses we have built, and confirm our assumtions.
How to calculate Correlation?
The formula, where x and y are the two variables for which we want to calculate correlation.
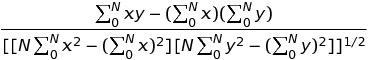
Let’s do the math! Not really. We’ll let excel do it for us.
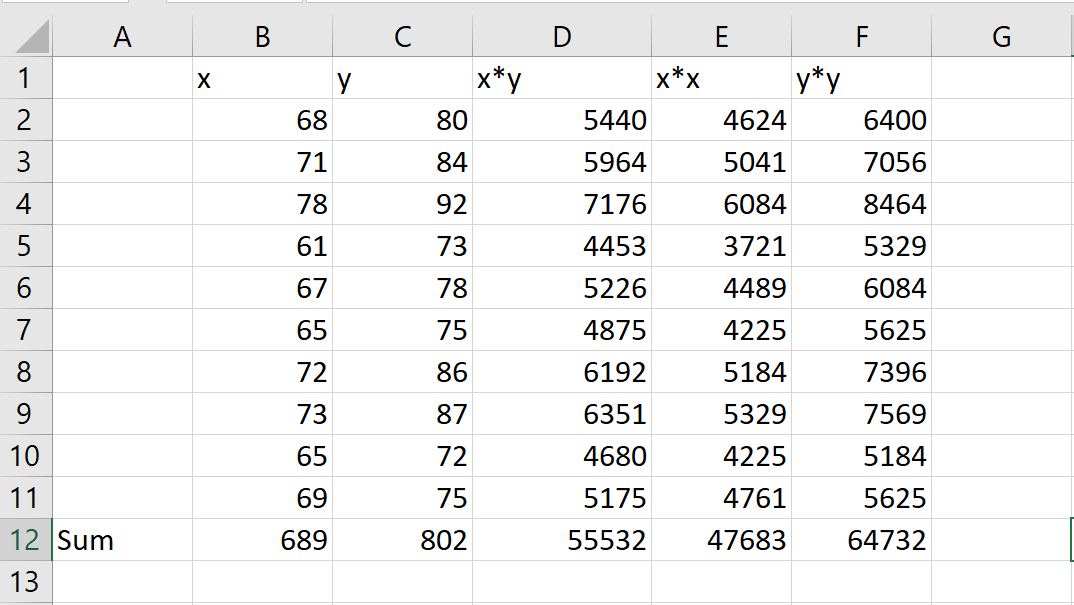
Now that we have all the valus we need for the formula, let’s plug these in and try to figure out the result. On calculating, we get a correlation value of 0.930. This is a very strong positive correlation. Let’s try plotting these out, for a more intutive understanding.
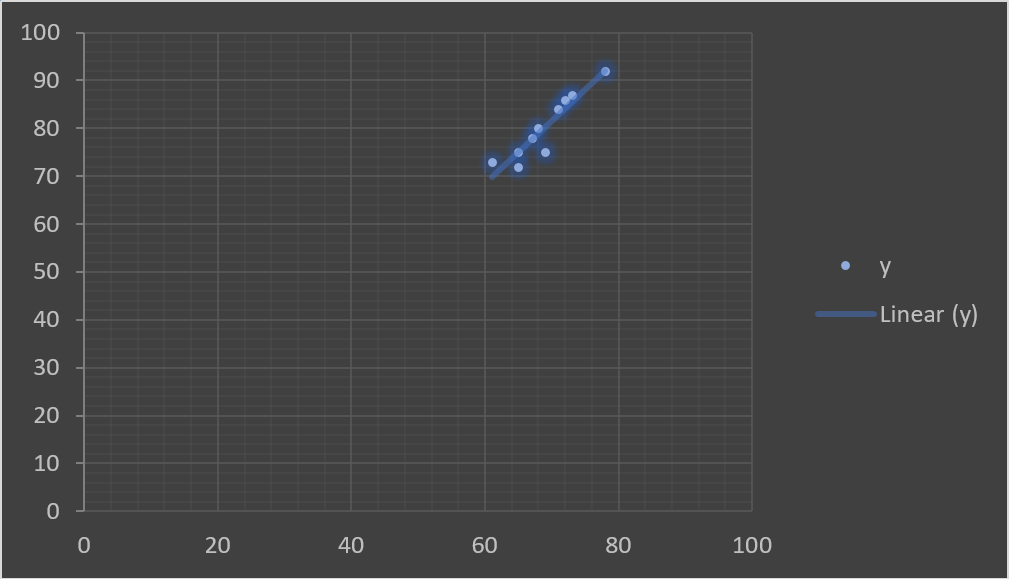
What do you see in this graph? There’s almost a positive linear relationship between our two variables. This supports our hypotheses that there’s a positive relationship between the height and weight of an individual.
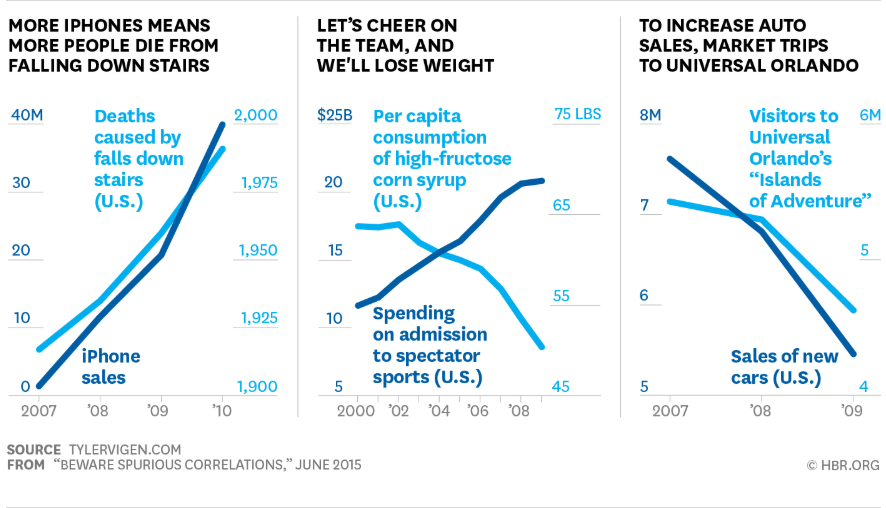
But we’re not done yet. While there’s at least some relation between the height and the weight of an individual, there’s a pretty good chance that the correlation you have was a matter of chance. Are these values actually related, or is it spurious correlation at play? This happens when two variables show common trends and have a strong correlation, but are not actually related. For example, there’s a pretty strong correlation (0.66) between the Number of people who drowned by falling into a pool and the number of films Nicolas cage has appeared in. Does that mean that one event causes the other? No (Maybe ;). It means that two unrelated variables(events) may have high correlation, but may not be dependent on each other, or there’s a third variable that we’re not taking into account. This may be seem obvious from the Nicolas cage example, but this is a very common mistake that data scientists do while engineering their features for their mathematical models.
So how do we figure out if a correlation is spurious or not?
Reichenbach’s Common Cause principle
”Suppose both lamps in a room go out suddenly. We regard it as improbable that by chance both bulbs burned out at the same time and look for a burned out fuse or some other interruption of the common power supply. The improbable coincidence is thus explained as the product of a common cause.”
Simply put, Reichenbach’s principle states that :
if two physical variables Y and Z are found to be statistically dependent, then there should be a causal explanation of this fact, either:
- Y is a cause of Z;
- Z is a cause of Y ;
- There is no causal link between Y and Z, but there is a common cause, X, influencing Y and Z;
- Y is a cause of Z and there is a common cause, X,influencing Y and Z; or
- Z is a cause of Y and there is a common cause, X, inuencing Y and Z.
For example, if a correlation is found between Dog ownership and Video game sales, it implies that :
- Dog Ownership Leads to Video game sales
- Video game sales lead to dog ownership
- There is no casual link between a person having a dog and buying a game, but there’s a third factor - wether or not the person having a dog has a sibling, that impacts video games sales.
- Dog Ownership Leads to Video game sales, with having a sibling being an influencing factor for having a dog, or buying a video game.
- Video game sales lead to dog ownership, with having a sibling being an influencing factor for having a dog, or buying a video game.
If we encouter situations like those present in #1 and #2, we’re good. We’ve found what statisticians call a causal relationship. No, not Casual. Causal. It’s the situations present in #3, #4, and #5 that are that are tough to crack. It’s just that we’re so desperate and want to believe that a relationship exists between two seemingly unrelated events, that we come up with a third event that we believe justifies the mathematically percieved correlation. Causal Relationships are cruicial in diverse fields like finance (Does an event in hong Kong impact the price of a share in New York?) or the Pharmaceutical industry (Does a particular drug have the necessary impact on the symptoms shown, or is there another factor that’s causing those symptomps?)
I just realised I’m overstaying my welcome with a post this long. Let’s do this. We’ll pause here for a while, I’ll let you think/research about some (if any) of the stuff you found interesting, and I’ll continue with a deep dive into causal networks in the next post. Till then, Cheers.